We Don’t Just Test Our Meat. We Coach Our Farmers.
Most brands don’t know how nutritious their meat is. We send samples from individual farms to an independent lab, and we use the data to coach our farmers — farm by farm, quarter by quarter.
Independent Edacious lab analysis, October 2026
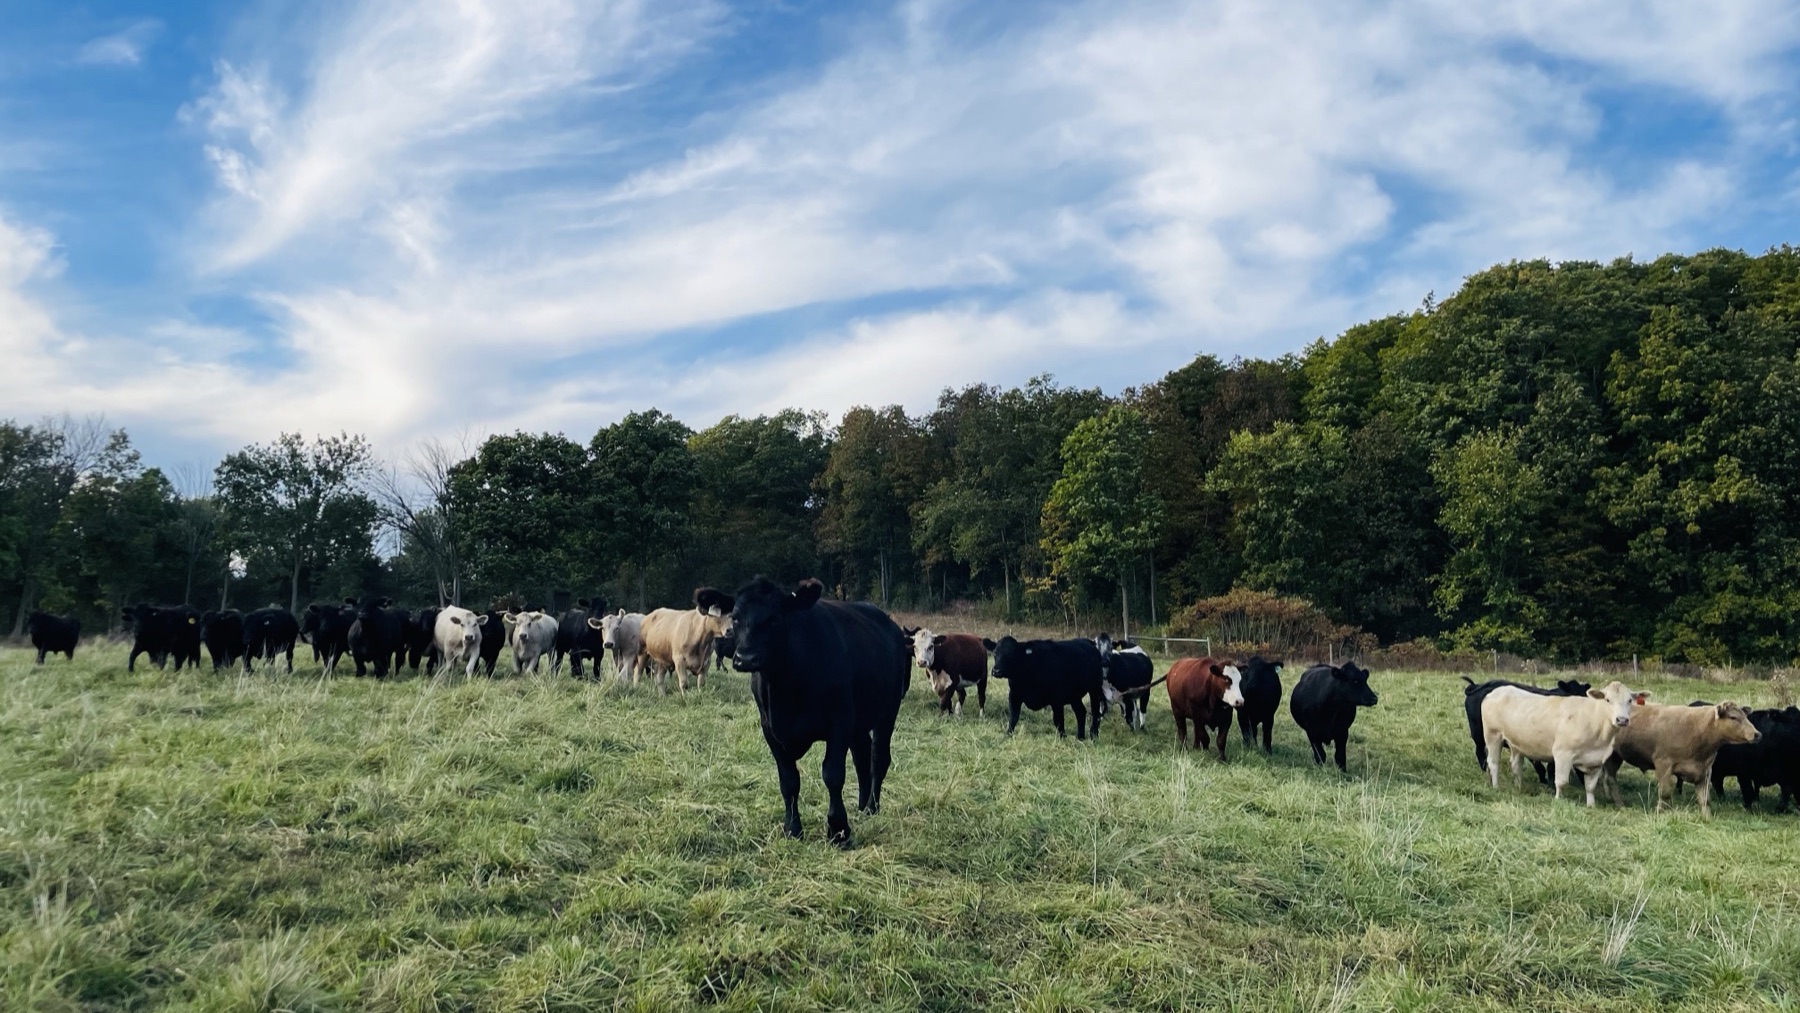
Independently tested. Farm by farm.
We wanted to know what’s actually in our meat, and which farms were producing it. So we started testing each farm individually.
The lab is Edacious, an ISO 17025-accredited facility in Massachusetts. Every farm in our network is tested across the year, and we publish the full range, including the farms still early in the work.
Walden vs. the commodity benchmark.
What we measured in October 2026, against USDA commodity comparison values — and what each one means at your table.
| What we tested | USDA commodity | What we measured | Why it matters |
|---|---|---|---|
| Omega-3 fatty acids | At the commodity baseline | 10×–12× more at the median | The essential fats most everyday diets fall short on. Our best single farm measured 28× the commodity value in ribeye. |
| Omega-6:3 balance | ~15:1 | As low as 1.1:1 | A lower ratio is the fat balance researchers associate with a calmer inflammatory response. Our strongest farms land where almost no retail beef does. |
| Vitamin E | At the commodity baseline | 4×–8× more | Vitamin E rises with fresh forage in the diet. It climbed sharply between our two testing rounds, which is exactly what you’d expect from cattle finishing on grass rather than feedlot grain. |
| Iron | Commodity baseline | About even | Comparable to commodity in beef. No meaningful difference either way. |
| Protein | Commodity baseline | About even | Protein tracks closely with how lean a cut is. Several of our cuts carry more marbling and fat than their commodity counterparts, while some carry less per 100 g. |
| Zinc & selenium | Commodity baseline | Slightly below | Our beef measures below commodity on both. Trace minerals track soil, and we’re working through what that means across our farms. We publish it because it’s what the lab found. |
| Total fat | Commodity baseline | Higher in several cuts | More fat, and a different kind of fat, by design. It’s where the omega-3s and the flavor live. |
| Independent testing | Rarely tested, rarely disclosed | ISO 17025 lab · farm by farm · every quarter | The difference between a label and a lab result — and between a brand average and a named farm. |
All figures are Walden vs. USDA commodity comparison values, per 100 g, from an independent, ISO 17025-accredited lab analysis (October 2026, beef cuts). Results vary by farm, protein and cut. Some vitamins and minerals come in similar to or below USDA comparison values — see “The whole picture” below. Chicken and lamb figures from this round are being re-tested before publication; see the FAQs.
Why pasture changes what’s in the meat.
The differences our lab keeps finding aren’t mysterious. They come down to how a ruminant actually turns forage into fat, and how little a label can tell you about that.
The rumen is the reason
A cow’s stomach breaks down most of the fat she eats before it ever reaches her muscle. You can’t simply add omega-3 to feed and expect it to appear in the steak. What does carry through is time, the weeks an animal spends grazing fresh, growing pasture, especially late in life. That is where beef and lamb get their omega-3.
Vitamin E is the fingerprint of fresh grass
Living green forage is rich in vitamin E. Hay, silage and grain carry far less of it. So the vitamin E in a steak is a reliable trace of how much fresh pasture was in the diet, and it is an antioxidant that also helps the colour and keeping quality of the beef. In our results, vitamin E and omega-3 move together.
What grows in the pasture matters
The omega-3 sits in the leafy growth of a pasture, not the stems. In published work, the most diverse pastures produced the best results. That is why a grazing plan — rotation, rest, and a varied mix of species in the sward — does more than simply having animals outdoors.
“Grass-fed” is a practice, not a result
In a 2026 study of more than 250 grass-fed ribeyes, the omega-6 to omega-3 ratio ranged from 0.62:1 all the way to 11.45:1. Some samples sold as grass-fed tested like grain-fed beef. A label tells you what was intended. Only a lab tells you what actually happened.
Grades measure marbling, not nutrition
Prime, Choice and Select score marbling and maturity. They say nothing about omega balance, fatty acids, vitamins or minerals. A beautifully marbled steak and a nutrient-dense steak are two separate measurements, and the grade on the box can only tell you about the first.
Chicken and pork work differently
Birds and pigs have no rumen, so what they eat passes almost directly into the meat. For poultry and pork the feed ration sets the fatty-acid balance far more than pasture access does. It is a different lever, and it is why our chicken results sit where they do.
Ruminant fat metabolism and the vitamin E relationship are well established in animal science. Grass-fed range figures are from a 2026 Journal of Animal Science analysis of 253 grass-fed ribeyes; they are research context rather than a benchmark for our own suppliers.
Averages hide what matters.
When you blend every farm into one number, you learn almost nothing. Great results are masked by poor ones. Opportunities to improve are squandered. And in the case of large programs, the likelihood of “cherry-picking” the best results goes way up.
So in October we pulled samples farm by farm, with named producers and real lot numbers and dates behind every result. What came back was a range, not a number. And an opportunity to keep raising the bar on quality.
The best farms in our network produced beef with an omega-6 to omega-3 ratio of 1.1:1. The USDA commodity comparison value is roughly 15:1. Some of our farms landed closer to the middle. That gap is the most useful thing we own, because it tells us exactly where to go to work.
Every dot is a farm.
Omega-6 to omega-3 ratio, October 2026. Lower is better. Each green dot is one sample from one named farm in our network. The rust marker on the right is the USDA commodity comparison value for the same cut.
One Walden farm sampleUSDA commodity comparison
Omega-6:3 ratio, Edacious analysis, October 2026, per 100 g.
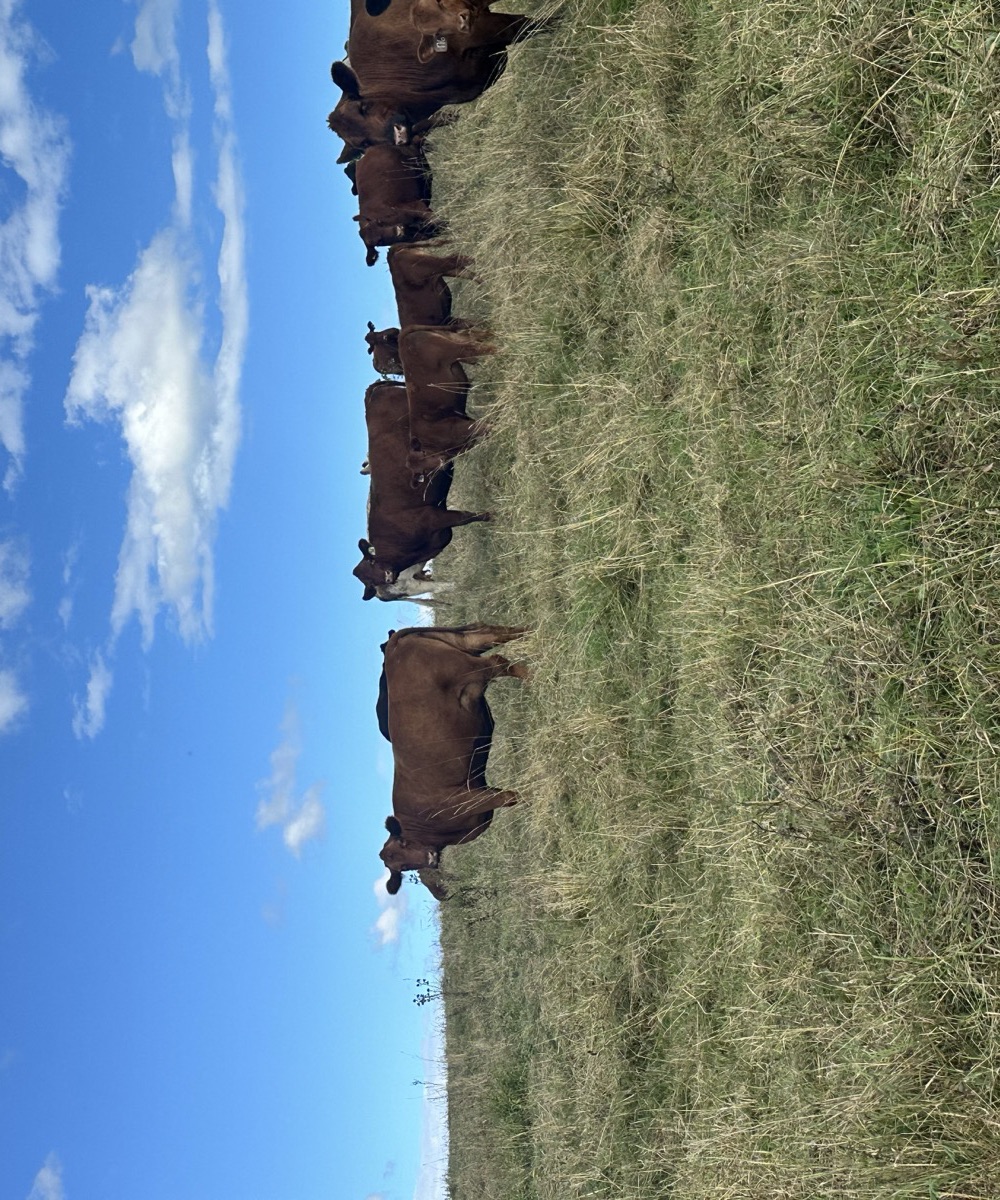
A little better, every day.
Across our latest beef samples, the best farm measured an omega-6 to omega-3 ratio of 1.1:1. The weakest measured 9.4:1. That’s a true gap, inside one network, in the same season.
We could have published the average and called it a win. Instead we’re publishing the range, because that’s how we identify the specific practices that lead to more nutrient density in a given context.
Keep Testing. Keep Learning.
Farms rotate through independent testing every quarter until every producer and every protein in our network has been covered, then the cycle continues. The goal is to find out which regenerative practices are delivering measurable results, and helping every farm learn from them.
Analysis: Edacious · October 2026 · Next round: Q1 2027
Follow it back to the farm.
Every dot on that chart is a family. See the farms, animals and practices behind the numbers.

Know More About Your Meat.
Nutrition FAQs
Straight answers about what we measured and what the results show.
Why publish results farm by farm?
Because a brand average can hide almost anything. In our October 2026 round, the strongest farm’s ribeye measured an omega-6 to omega-3 ratio of 1.1:1 and the weakest measured 9.4:1. Blended together they’d read as one unremarkable number, and we’d have learned nothing. Tested separately, we know precisely which farms to work with and on what.
Is grass-fed beef actually more nutritious?
It depends on what you measure, and on the farm. In our October 2026 Edacious analysis, the clearest differences in Walden beef were in fatty-acid composition: 10–12× more omega-3 fatty acids than the USDA commodity comparison values at the median, and a vitamin E level four to eight times the comparison value. Protein measured slightly below to about even. Zinc and selenium measured below. We publish all of it.
What’s the omega ratio in Walden grass-fed beef?
It varies by farm, which is the honest answer. Across our October 2026 beef samples, ribeye ranged from 1.1:1 to 9.4:1 and ground beef from 1.3:1 to 5.1:1. The median ribeye measured 3.2:1 and the median ground beef 2.5:1. The USDA commodity comparison value is approximately 15:1. We’re not drawing a finish line yet. The first job is knowing exactly where each farm sits, so we can work out what the strongest ones are doing and help the rest get there.
Is Walden meat lab tested?
Yes, and increasingly at the farm rather than the brand. Our October 2026 round sent 20 samples across six cuts to Edacious, an independent, ISO 17025-accredited laboratory in Massachusetts, each traced to a named producer, pack date and lot number. Farms rotate through testing quarterly so that every producer and protein in the network is covered within the program year.
What about chicken, pork and lamb?
They’re in the rotation, and we’re holding some of those results back until we’re confident in them. Our October chicken samples were prepared skin-off where the previous round was skin-on, which changes every fat-linked measurement and makes the two rounds impossible to compare fairly. Our October lamb samples spent far longer in storage before reaching the lab than our beef did, which can affect delicate fats. Both are being re-tested. We’d rather publish late than publish something we can’t stand behind.
Is Walden meat higher in protein or vitamins?
It depends on the cut and the nutrient. Protein measured slightly below to about even with USDA comparison values across the beef cuts in our October 2026 round. Vitamin E measured four to eight times the comparison value. Zinc and selenium measured below it. The most consistent difference, round after round, is in fatty-acid composition.
Why does Walden publish its testing?
Because we want to understand our food as well as we know our farmers — and because a number you can’t check isn’t worth much. Independent testing gives us a way to measure what we’re doing, learn from it, and show members the results, including the ones that give us work to do.